Across 13 Congresses, most in the
117th at 132.
In the 119th,
114 —
88 more than the median representative, who filed 26.
Volume is not influence: the great majority of bills, from every
member, never get a vote.
Bills introduced, against the typical representative107th to 119th
24107th Congresstypical member 13
27108th Congresstypical member 13
35109th Congresstypical member 16
49110th Congresstypical member 18
55111th Congresstypical member 16
54112th Congresstypical member 15
67113th Congresstypical member 13
66114th Congresstypical member 15
98115th Congresstypical member 18
105116th Congresstypical member 21
132117th Congresstypical member 23
128118th Congresstypical member 24
114119th Congresstypical member 26
median for the chamber, that Congress
Biography
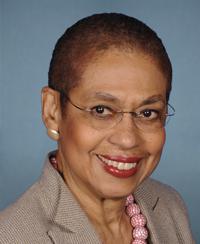
A Delegate from the District of Columbia. Born in Washington, D. C. , June 13, 1937. Graduated from Dunbar High School, Washington, D. C. B. A. , Antioch College, Yellow Springs, Ohio, 1960. M. A. , Yale University, New Haven, Conn. , 1963. LL. B. , Yale University Law School, New Haven, Conn. , 1964. Lawyer, private practice. Law clerk to Federal District Court Judge A. Leon Higginbotham, 3rd Circuit, 1964-1965. Assistant legal director, American Civil Liberties Union, 1965-1970. Adjunct assistant professor, New York University Law School, 1970-1971. Staff, New York, N. Y. Mayor John Lindsay, 1971-1974. Chair, New York City commission on human rights, 1970-1977. Chair, United States Equal Employment Opportunity Commission, 1977-1981. Senior fellow, Urban Institute, 1981-1982. Professor, Georgetown University Law Center, 1982-1990. Elected as a Democrat to the One Hundred Second and to the seventeen succeeding Congresses (January 3, 1991-present).
Focus
Drawn from the 954 bills this member introduced: the subjects the record
assigns them, and the members who most often sign on.
Referred to the House Committee on International Relations.
Feb 25, 2004
Sections of the Congressional Record in which this member spoke or entered a written statement, as the Government Publishing Office tags them; floor business such as amendment texts is left out. Each links to the official Record.
Current committees first, each with its role and years, and the subcommittees held now beneath it. Full history opens every role with its date and official record, and earlier subcommittee seats.
What this member's House office spent each year from its allowance, including interns, from the House's
quarterly Statement of Disbursements. Beside it, the typical office: the median across every member that year.
Year
Total
Staff pay
Travel
Rent and utilities
Mail
Printing
Other
Typical office
2026 to Jun
$954,625
$802,406
$131
$105,797
-$39
$420
$45,911
–
2025
$2.0 million
$1.6 million
$244
$222,162
$812
$8,229
$96,322
$1.9 million
2024
$2.0 million
$1.8 million
$1,679
$109,965
$1,427
$953
$86,990
$1.9 million
2023
$1.9 million
$1.7 million
$739
$107,203
$541
$7,371
$121,720
$1.9 million
2022
$1.5 million
$1.3 million
$489
$106,604
$848
$865
$78,412
$1.7 million
2021
$1.3 million
$1.1 million
$236
$105,883
$554
$826
$96,468
$1.5 million
2020
$1.2 million
$1.1 million
$723
$115,588
$412
$2,675
$74,765
$1.4 million
2019
$1.3 million
$1.0 million
$2,839
$155,536
$818
$16,644
$103,454
$1.4 million
2018
$1.3 million
$986,806
$1,016
$165,054
$772
$4,676
$188,908
$1.3 million
2017
$1.2 million
$977,214
$1,297
$165,658
$484
$6,350
$87,935
$1.3 million
2016
$1.3 million
$993,461
$2,098
$184,205
$164
$3,226
$71,012
$1.2 million
Years run from January 3. Bills for a year are often paid early the next year, so a recent year can still grow.
Staff pay is the office's total; individual salaries are not shown here.
The district
Who lives in DC‑At large, as drawn for the 119th Congress,
from the Census Bureau's American Community Survey for 2025,
beside the state and the nation.
Population
693,645
DC 693,645 · U.S. 341,784,859
Median household income
$109,505
DC $109,505 · U.S. $84,780
Median age
35.0
DC 35.0 · U.S. 39.5
Below the poverty line
15.9%
DC 15.9% · U.S. 11.8%
Bachelor's degree or higher (25 and over)
64.9%
DC 64.9% · U.S. 37.4%
Veterans (of adults)
3.5%
DC 3.5% · U.S. 5.9%
Full profile
People
District
DC
U.S.
Population
693,645
693,645
341,784,859
Median age
35.0±0.1
35.0
39.5
Under 18
17.9%±0.1%
17.9%
21.0%
65 and over
13.6%±0.1%
13.6%
19.0%
Citizens 18 and over
521,375±5,936
521,375
249,178,715
Veterans (of adults)
3.5%±0.5%
3.5%
5.9%
With a disability
11.6%±1.1%
11.6%
13.7%
Born outside the U.S.
14.8%±1.0%
14.8%
14.7%
Speak a language other than English at home
20.0%±1.2%
20.0%
22.9%
Race and ethnicity
District
DC
U.S.
Hispanic or Latino (any race)
12.9%
12.9%
20.5%
White alone, not Hispanic
36.8%±0.2%
36.8%
55.0%
Black alone, not Hispanic
38.0%±0.9%
38.0%
11.7%
Asian alone, not Hispanic
5.5%±0.2%
5.5%
6.5%
American Indian and Alaska Native alone, not Hispanic
0.1%±0.1%
0.1%
0.6%
Income and work
District
DC
U.S.
Median household income
$109,505±$7,573
$109,505
$84,780
Income per person
$76,451±$2,210
$76,451
$47,171
Below the poverty line
15.9%±1.9%
15.9%
11.8%
Unemployment rate
7.2%±1.1%
7.2%
4.9%
No health insurance
4.3%±0.8%
4.3%
8.4%
Average commute
30.1±0.7
30.1
27.4
Jobs in manufacturing
1.4%±0.5%
1.4%
9.6%
Jobs in farming, forestry, fishing and mining
0.1%±0.1%
0.1%
1.4%
Jobs in education and health care
18.2%±1.6%
18.2%
24.4%
Education
District
DC
U.S.
High school graduate or higher (25 and over)
92.8%±1.1%
92.8%
90.6%
Bachelor's degree or higher (25 and over)
64.9%±1.5%
64.9%
37.4%
Housing
District
DC
U.S.
Households
333,195±4,240
333,195
134,063,422
Housing units
371,597±48
371,597
148,228,967
Homes lived in by their owners
38.1%±1.5%
38.1%
65.3%
Median home value
$715,500±$24,713
$715,500
$371,100
Median rent
$2,075±$51
$2,075
$1,557
Households with broadband
94.0%±1.0%
94.0%
94.0%
Survey estimates, each with its margin of error (±, at 90% confidence), for the district as drawn when the survey was taken. The map is at the top of the page.
Support LegiList
This page is free, carries no paywall, and is built and maintained
by one person. If the record here is useful to you, a few dollars
keeps it going.
Processed by Stripe in a separate window. LegiList never sees card details.
Party, state and chamber are those of this member's most recent term.
Bills and cosponsorships are held from the 107th Congress
onwards and recorded votes from the 101st, so a member
who served before those points will show fewer than they filed, or none.
Committee service is held from the 107th Congress
onwards, dated from the House and Senate resolutions and Congressional Record
notices that seat and remove members. Subcommittee assignments are made inside each
committee and carry no official date, so a subcommittee seat is shown from the first
to the last printed hearing, Congressional Directory edition or official roster that
lists the member.
Vote counts cover roll calls tied to a bill; the chambers
also vote on procedure and nominations, which are not listed here.
Records come from
Congress.gov and the
Biographical Directory of Congress.