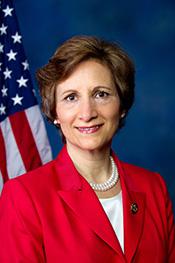
Suzanne Bonamici
2231 Rayburn House Office Building (202) 225-0855 Official site
As sponsor, from the 107th Congress
Of the bills they introduced
Signed on to someone else's bill
Roll calls tied to a bill
In the Congressional Record, from 2001
Held now, including subcommittees
Across 8 Congresses, most in the 118th at 71. In the 119th, 71 — 45 more than the median representative, who filed 26. Volume is not influence: the great majority of bills, from every member, never get a vote.
median for the chamber, that Congress
Biography
Focus
Drawn from the 274 bills this member introduced: the subjects the record assigns them, and the members who most often sign on.
Subjects
- Education 48
- Congressional oversight 45
- Government studies and investigations 39
- Government information and archives 32
- Health 27
- Marine and coastal resources, fisheries 27
- Labor and Employment 26
- Environmental Protection 23
Bills carry several subjects each, so these add up to more than 274.
Most frequent cosponsors
- Eleanor Holmes Norton 93
- Earl Blumenauer 63
- Brian K. Fitzpatrick 57
- Jared Huffman 43
- Jahana Hayes 43
- Raúl M. Grijalva 41
Times each has cosponsored a bill this member introduced.
Record
Every recorded vote, bill and floor speech, newest first.
Recorded votes tied to a bill, including procedural motions on it such as cloture. Votes on nominations are not listed.
| Bill | Question | Voted | Date |
|---|---|---|---|
| HR 8897 | On Motion to Suspend the Rules and Pass, as Amended | Yea | Jul 13, 2026 |
| HR 3106 | On Motion to Suspend the Rules and Pass | Yea | Jul 13, 2026 |
| HRES 1399 | On Agreeing to the Resolution | Yea | Jun 30, 2026 |
| HCONRES 108 | On Agreeing to the Resolution | Yea | Jun 30, 2026 |
| HRES 1398 | On Agreeing to the Resolution | No | Jun 30, 2026 |
| HRES 1398 | On Ordering the Previous Question | Nay | Jun 30, 2026 |
| HR 7128 | On Motion to Suspend the Rules and Pass, as Amended | Yea | Jun 29, 2026 |
| HR 7757 | On Motion to Suspend the Rules and Pass, as Amended | Nay | Jun 29, 2026 |
| Bill | Title | Status | Latest action |
|---|---|---|---|
| HR 10975 | Fair Manufactured Housing Lending Act | Referred to the House Committee on Financial Services. | Nov 10, 2026 |
| HRES 1625 | Expressing support for a whole child approach to education and recognizing the role of parents, educators, and community members in providing a whole child approach to education for each student. | Referred to the House Committee on Education and Workforce. | Oct 15, 2026 |
| HRES 1607 | Expressing support for the designation of September 2026 as "National Workforce Development Month". | Referred to the House Committee on Education and Workforce. | Oct 5, 2026 |
| HR 10649 | Safe Disposal of Opioids Act of 2026 | Referred to the House Committee on Energy and Commerce. | Oct 1, 2026 |
| HR 10515 | Artificial Intelligence Education and Workforce Readiness Act of 2026 | Referred to the Committee on Education and Workforce, and in addition to the Committees on Science, Space, and Technology, and Ways and Means, for a period to be subsequently determined by the Speaker, in each case for consideration of such provisions as fall within the jurisdiction of the committee concerned. | Sep 21, 2026 |
| HR 10421 | Transforming Education for the Future Act | Referred to the Committee on Education and Workforce, and in addition to the Committees on the Judiciary, Energy and Commerce, Ways and Means, Oversight and Government Reform, Science, Space, and Technology, Armed Services, and Agriculture, for a period to be subsequently determined by the Speaker, in each case for consideration of such provisions as fall within the jurisdiction of the committee concerned. | Sep 16, 2026 |
| HR 2406 | National Oceanic and Atmospheric Administration Sexual Harassment and Assault Prevention Improvements Act of 2025 | Received in the Senate and Read twice and referred to the Committee on Commerce, Science, and Transportation. | Sep 15, 2026 |
| HRES 1538 | Supporting the designation of the week of September 14 through September 18, 2026, as "Malnutrition Awareness Week". | Referred to the Committee on Energy and Commerce, and in addition to the Committees on Agriculture, Education and Workforce, and Ways and Means, for a period to be subsequently determined by the Speaker, in each case for consideration of such provisions as fall within the jurisdiction of the committee concerned. | Sep 15, 2026 |
| Bill | Title | Status | Signed on |
|---|---|---|---|
| HR 10557 | Protection of Social Security Benefits Restoration Act | Referred to the Committee on the Judiciary, and in addition to the Committee on Ways and Means, for a period to be subsequently determined by the Speaker, in each case for consideration of such provisions as fall within the jurisdiction of the committee concerned. | Nov 10, 2026 |
| HRES 1385 | Celebrating the accomplishments of title IX of the Education Amendments of 1972, also known as the Patsy Takemoto Mink Equal Opportunity in Education Act, and recognizing the need to continue pursuing the goal of educational opportunities for all women and girls. | Referred to the House Committee on Education and Workforce. | Nov 10, 2026 |
| HR 10969 | Healthy Meal Time Act of 2026 | Referred to the House Committee on Education and Workforce. | Nov 9, 2026 |
| HR 10947 | Monitor Microplastics Now Act | Referred to the House Committee on Energy and Commerce. | Nov 9, 2026 |
| HR 10574 | American Leadership in Fusion Act | Referred to the House Committee on Science, Space, and Technology. | Nov 9, 2026 |
| HR 5940 | Seniors Deserve SMARTER Care Act of 2025 | Referred to the Committee on Ways and Means, and in addition to the Committee on Energy and Commerce, for a period to be subsequently determined by the Speaker, in each case for consideration of such provisions as fall within the jurisdiction of the committee concerned. | Nov 9, 2026 |
| HR 9216 | Double the Wage for Overtime Act of 2026 | Referred to the House Committee on Education and Workforce. | Nov 2, 2026 |
| HR 637 | 911 SAVES Act | Referred to the House Committee on Education and Workforce. | Nov 2, 2026 |
Sections of the Congressional Record in which this member spoke or entered a written statement, as the Government Publishing Office tags them; floor business such as amendment texts is left out. Each links to the official Record.
| Date | Record section | Where |
|---|---|---|
| Sep 14, 2026 | National Oceanic and Atmospheric Administration Sexual Harassment and Assault Prevention Improvements Act of 2025 | House floor |
| Sep 14, 2026 | Future of American Education | House floor |
| Jul 13, 2026 | Celebrating the Centennial Rededication of the Astoria Column | Written statement |
| Jun 25, 2026 | IMPEACHMENT OF SECRETARY McMAHON | House floor |
| Jun 3, 2026 | No Funds for Repeat Child Care Violations Act of 2026 | House floor |
| Jun 3, 2026 | Recognizing Capitol Hill Ocean Week | House floor |
| May 20, 2026 | Parental Rights Over the Education and Care of Their Kids Act | House floor |
| May 19, 2026 | Providing for the Concurrence by the House in the Senate Amendment to H.R. 6644, with Amendment | House floor |
Committees
Current committees first, each with its role and years, and the subcommittees held now beneath it. Full history opens every role with its date and official record, and earlier subcommittee seats.
Full history
| Committee | Role | Served | Record |
|---|---|---|---|
| Education and Workforce Committee | Member | Jan 3, 2013 to Present | H.Res. 7 |
| Early Childhood, Elementary, and Secondary Education | Ranking Member | Listed Apr 2023 to present | Hearing, Apr 2023 |
| Higher Education and Workforce Development | Member | Listed Mar 2019 to present | Hearing, Mar 2019 |
| Civil Rights and Human Services | Chair | Listed Feb 2019 to Oct 2022 | Hearing, Feb 2019 |
| Health, Employment, Labor, and Pensions | Member | Listed Feb 2014 to Jul 2018 | Congressional Directory, Feb 2014 |
| Early Childhood, Elementary, and Secondary Education | Member | Listed Feb 2015 to Jul 2018 | Hearing, Feb 2015 |
| Higher Education and Workforce Training | Member | Listed Feb 2013 to Sep 2014 | Hearing, Feb 2013 |
| Workforce Protections | Member | Listed Jul 2013 to Jul 2013 | Hearing, Jul 2013 |
| Workforce Protections | Member | Listed May 2013 to May 2013 | Hearing, May 2013 |
Full history
| Committee | Role | Served | Record |
|---|---|---|---|
| Science, Space, and Technology Committee | Member | Feb 16, 2012 to Present | H.Res. 553 |
| Environment | Member | Listed Feb 2013 to present | Hearing, Feb 2013 |
| Investigations and Oversight | Member | Listed Mar 2025 to present | Hearing, Mar 2025 |
| Research and Technology | Member | Listed May 2023 to May 2024 | Hearing, May 2023 |
| Energy | Member | Listed Mar 2021 to Oct 2022 | Hearing, Mar 2021 |
| Investigations and Oversight | Member | Listed Mar 2019 to Sep 2020 | Hearing, Mar 2019 |
| Research and Technology | Member | Listed Feb 2015 to Jul 2018 | Hearing, Feb 2015 |
| Space | Member | Listed Feb 2013 to Dec 2014 | Hearing, Feb 2013 |
| Technology and Innovation | Member | Listed Mar 2012 to Nov 2012 | Hearing, Mar 2012 |
| Research and Science Education | Member | Listed Apr 2012 to Aug 2012 | Hearing, Apr 2012 |
Earlier committees
Office spending
What this member's House office spent each year from its allowance, including interns, from the House's quarterly Statement of Disbursements. Beside it, the typical office: the median across every member that year.
| Year | Total | Staff pay | Travel | Rent and utilities | Printing | Other | Typical office | |
|---|---|---|---|---|---|---|---|---|
| 2026 to Jun | $854,478 | $761,035 | $10,680 | $55,366 | $582 | $494 | $26,321 | – |
| 2025 | $2.0 million | $1.7 million | $46,912 | $119,782 | $2,212 | $1,984 | $72,138 | $1.9 million |
| 2024 | $2.0 million | $1.7 million | $44,184 | $118,785 | $13,274 | $28,830 | $91,539 | $1.9 million |
| 2023 | $1.9 million | $1.6 million | $38,038 | $135,525 | $6,654 | $15,452 | $102,678 | $1.9 million |
| 2022 | $1.9 million | $1.6 million | $54,954 | $114,910 | $1,040 | $1,643 | $125,553 | $1.7 million |
| 2021 | $1.5 million | $1.3 million | $14,186 | $106,813 | $12,689 | $27,262 | $96,255 | $1.5 million |
| 2020 | $1.5 million | $1.2 million | $11,714 | $102,561 | $25,857 | $59,751 | $62,502 | $1.4 million |
| 2019 | $1.4 million | $1.1 million | $43,521 | $149,800 | $22,097 | $16,752 | $83,116 | $1.4 million |
| 2018 | $1.4 million | $1.1 million | $57,801 | $94,063 | $23,460 | $18,309 | $98,175 | $1.3 million |
| 2017 | $1.4 million | $1.1 million | $53,510 | $91,963 | $19,555 | $13,814 | $52,949 | $1.3 million |
| 2016 | $1.3 million | $1.1 million | $55,096 | $90,076 | $2,887 | $1,226 | $53,833 | $1.2 million |
Years run from January 3. Bills for a year are often paid early the next year, so a recent year can still grow. Staff pay is the office's total; individual salaries are not shown here.
The district
Who lives in OR‑1, as drawn for the 119th Congress, from the Census Bureau's American Community Survey for 2025, beside the state and the nation.
OR 4,273,586 · U.S. 341,784,859
OR $86,953 · U.S. $84,780
OR 41.3 · U.S. 39.5
OR 11.7% · U.S. 11.8%
OR 36.6% · U.S. 37.4%
OR 6.4% · U.S. 5.9%
| People | District | OR | U.S. |
|---|---|---|---|
| Population | 734,045±12,355 | 4,273,586 | 341,784,859 |
| Median age | 39.4±0.6 | 41.3 | 39.5 |
| Under 18 | 18.4%±0.7% | 18.9% | 21.0% |
| 65 and over | 17.4%±0.6% | 20.9% | 19.0% |
| Citizens 18 and over | 542,827±11,227 | 3,272,336 | 249,178,715 |
| Veterans (of adults) | 5.0%±0.6% | 6.4% | 5.9% |
| With a disability | 13.9%±0.8% | 15.9% | 13.7% |
| Born outside the U.S. | 16.3%±1.1% | 10.0% | 14.7% |
| Speak a language other than English at home | 23.2%±1.4% | 15.8% | 22.9% |
| Race and ethnicity | District | OR | U.S. |
|---|---|---|---|
| Hispanic or Latino (any race) | 17.0%±0.8% | 16.2% | 20.5% |
| White alone, not Hispanic | 61.2%±0.9% | 67.8% | 55.0% |
| Black alone, not Hispanic | 2.2%±0.4% | 2.0% | 11.7% |
| Asian alone, not Hispanic | 10.4%±0.7% | 4.8% | 6.5% |
| American Indian and Alaska Native alone, not Hispanic | 0.5%±0.2% | 0.8% | 0.6% |
| Income and work | District | OR | U.S. |
|---|---|---|---|
| Median household income | $98,867±$4,638 | $86,953 | $84,780 |
| Income per person | $56,085±$1,861 | $47,424 | $47,171 |
| Below the poverty line | 9.1%±1.1% | 11.7% | 11.8% |
| Unemployment rate | 4.6%±0.7% | 5.4% | 4.9% |
| No health insurance | 4.9%±0.6% | 5.4% | 8.4% |
| Average commute | 23.8±0.7 | 23.6 | 27.4 |
| Jobs in manufacturing | 15.6%±1.2% | 10.7% | 9.6% |
| Jobs in farming, forestry, fishing and mining | 0.8%±0.3% | 2.4% | 1.4% |
| Jobs in education and health care | 23.7%±1.4% | 25.3% | 24.4% |
| Education | District | OR | U.S. |
|---|---|---|---|
| High school graduate or higher (25 and over) | 93.5%±0.8% | 92.2% | 90.6% |
| Bachelor's degree or higher (25 and over) | 49.1%±1.5% | 36.6% | 37.4% |
| Housing | District | OR | U.S. |
|---|---|---|---|
| Households | 307,043±7,270 | 1,745,361 | 134,063,422 |
| Housing units | 343,076±6,249 | 1,909,202 | 148,228,967 |
| Homes lived in by their owners | 55.0%±1.8% | 63.1% | 65.3% |
| Median home value | $589,100±$12,918 | $507,900 | $371,100 |
| Median rent | $1,779±$37 | $1,629 | $1,557 |
| Households with broadband | 95.5%±0.8% | 94.7% | 94.0% |
Survey estimates, each with its margin of error (±, at 90% confidence), for the district as drawn when the survey was taken. The map is at the top of the page.
Party, state and chamber are those of this member's most recent term. Bills and cosponsorships are held from the 107th Congress onwards and recorded votes from the 101st, so a member who served before those points will show fewer than they filed, or none. Committee service is held from the 107th Congress onwards, dated from the House and Senate resolutions and Congressional Record notices that seat and remove members. Subcommittee assignments are made inside each committee and carry no official date, so a subcommittee seat is shown from the first to the last printed hearing, Congressional Directory edition or official roster that lists the member. Vote counts cover roll calls tied to a bill; the chambers also vote on procedure and nominations, which are not listed here. Records come from Congress.gov and the Biographical Directory of Congress.
