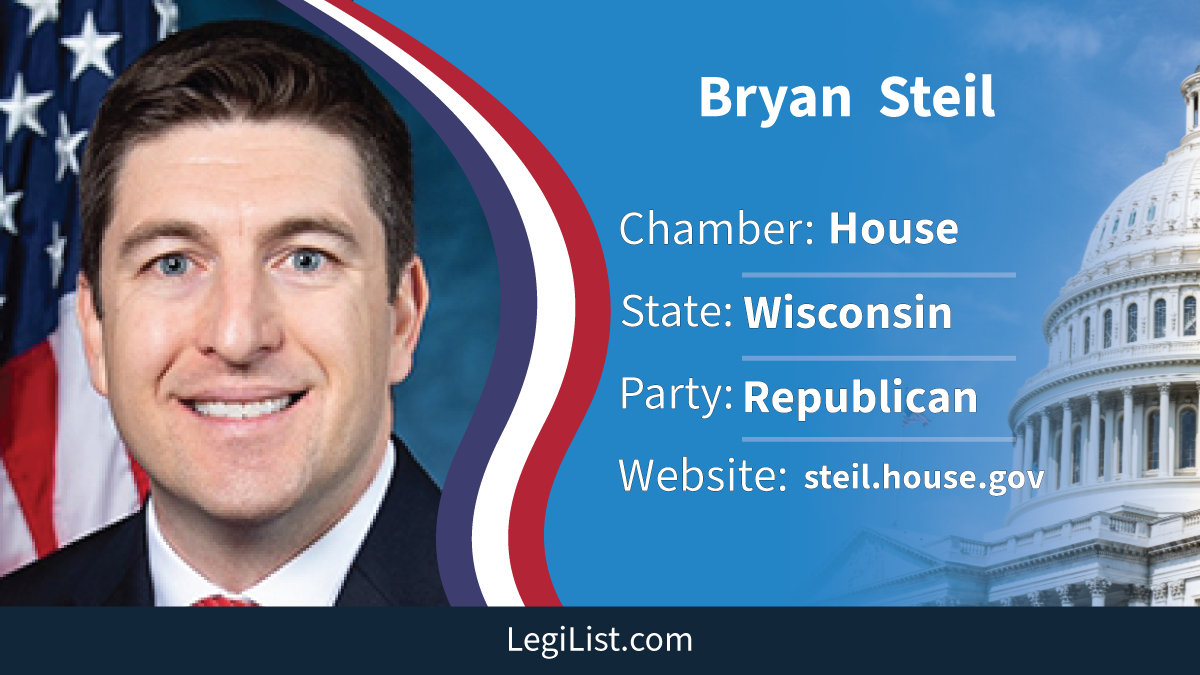
Bryan Steil
FEC Campaign Finance
U.S. Representative
•
WI – District 1
Republican
•
Service: 2019-present
Election Cycle
Overview – 2018
Total Raised
$2,314,019
Total Spent
$2,287,663
Cash on Hand
$26,356
Individual Contributions
$1,671,551
PAC + Party Money
$466,243
Self-Funding
$796
Coverage Through
December 31, 2018
Source of Funds
| Source | Amount | Share |
|---|---|---|
| Large Individual ($200+) | $1,602,674 | 69.3% |
| Small Individual (<$200) | $68,877 | 3.0% |
| PACs & Party | $466,243 | 20.1% |
| Self-Funding | $796 | 0.0% |
| Other | $175,429 | 7.6% |
Top Individual Donors
| Rank | Donor | Location | Total |
|---|---|---|---|
| #1 | P***** W. | CHICAGO, IL | $13,500 |
| #2 | M****** J. | EAU CLAIRE, WI | $13,500 |
| #3 | C****** D. | JANESVILLE, WI | $10,850 |
| #4 | H***** E. | MADISON, WI | $8,100 |
| #5 | B**** T. | MANITOWISH WATERS, WI | $8,100 |
Top Spending Recipients (Vendors)
| Rank | Payee / Vendor | Total |
|---|---|---|
| #1 | Flexpoint Media, Inc. | $1,463,295 |
| #2 | Scm Associates | $197,977 |
| #3 | Public Opinion Strategies, L.L.C. | $60,308 |
| #4 | Payroll Data Services, Inc | $56,181 |
| #5 | Red Print Strategy | $51,500 |
Top Employer Contributors (via Employees)
| Rank | Employer | Total |
|---|---|---|
| #1 | Retired | $317,306 |
| #2 | Homemaker | $191,025 |
| #3 | Self Employed | $76,592 |
| #4 | Not Employed | $67,035 |
| #5 | Self-Employed | $21,950 |
Where Donations Came From
| Rank | State | Total | Donors | Share |
|---|---|---|---|---|
| #1 | WI | $1,144,320 | 1,159 | 71.4% |
| #2 | IL | $136,800 | 78 | 8.5% |
| #3 | FL | $83,975 | 37 | 5.2% |
| #4 | NY | $41,102 | 35 | 2.6% |
| #5 | CA | $26,645 | 36 | 1.7% |
| #6 | TX | $23,950 | 14 | 1.5% |
| #7 | DC | $22,487 | 26 | 1.4% |
| #8 | VA | $16,850 | 18 | 1.1% |
| #9 | WA | $14,000 | 6 | 0.9% |
| #10 | MD | $10,100 | 3 | 0.6% |
| #11 | CT | $9,500 | 10 | 0.6% |
| #12 | CO | $8,225 | 7 | 0.5% |
| #13 | KS | $6,550 | 5 | 0.4% |
| #14 | MN | $5,450 | 4 | 0.3% |
| #15 | NV | $5,400 | 2 | 0.3% |
| #16 | MT | $5,400 | 2 | 0.3% |
| #17 | NC | $3,700 | 2 | 0.2% |
| #18 | UT | $3,400 | 4 | 0.2% |
| #19 | AR | $3,050 | 3 | 0.2% |
| #20 | TN | $2,950 | 2 | 0.2% |
| #21 | MI | $2,800 | 2 | 0.2% |
| #22 | WY | $2,700 | 1 | 0.2% |
| #23 | MO | $2,700 | 1 | 0.2% |
| #24 | NJ | $2,500 | 3 | 0.2% |
| #25 | OK | $2,500 | 3 | 0.2% |
| #26 | PA | $2,500 | 4 | 0.2% |
| #27 | GA | $2,125 | 4 | 0.1% |
| #28 | AZ | $1,695 | 4 | 0.1% |
| #29 | OH | $1,350 | 3 | 0.1% |
| #30 | IA | $1,250 | 2 | 0.1% |
| #31 | DE | $1,000 | 1 | 0.1% |
| #32 | SC | $1,000 | 3 | 0.1% |
| #33 | AL | $1,000 | 2 | 0.1% |
| #34 | ND | $1,000 | 1 | 0.1% |
| #35 | OR | $700 | 2 | 0.0% |
| #36 | LA | $500 | 1 | 0.0% |
| #37 | KY | $500 | 1 | 0.0% |
| #38 | MA | $500 | 1 | 0.0% |
| #39 | NH | $250 | 1 | 0.0% |
| #40 | NE | $250 | 1 | 0.0% |
All data sourced directly from FEC bulk files. Minor differences from other sites may occur due to filing amendments.