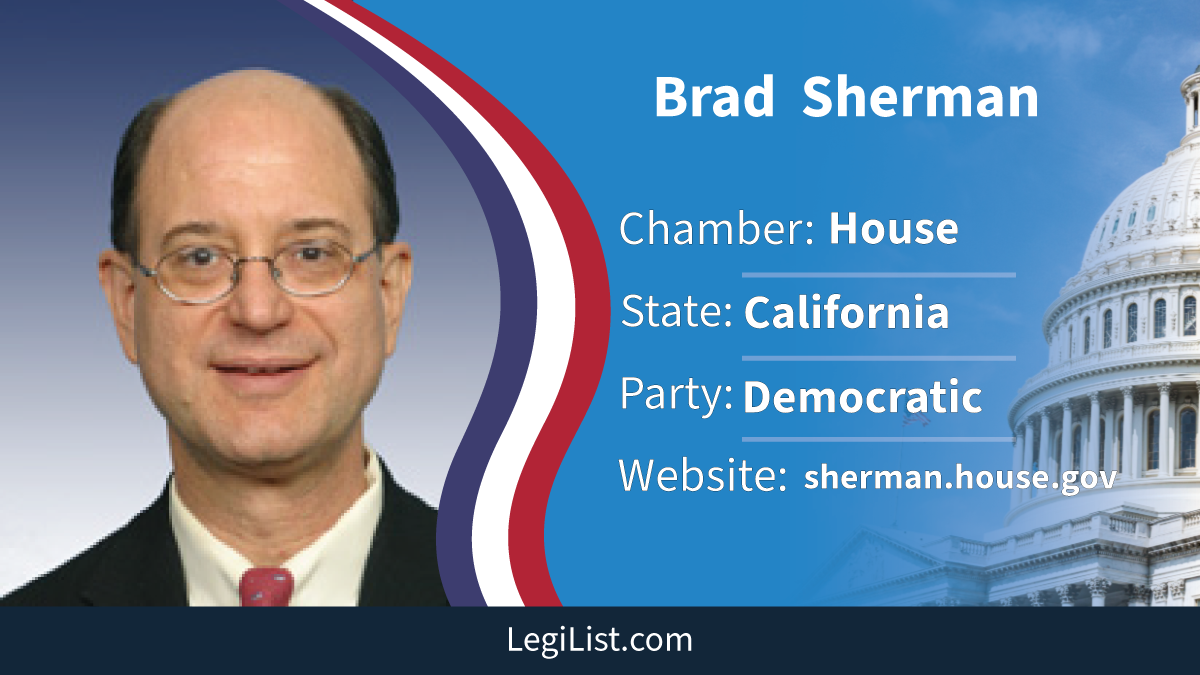
Brad Sherman
FEC Campaign Finance
U.S. Representative
•
CA – District 32
Democratic
•
Service: 1997-present
Election Cycle
Overview – 2014
Total Raised
$1,517,097
Total Spent
$1,327,754
Cash on Hand
$237,122
Individual Contributions
$733,147
PAC + Party Money
$643,887
Self-Funding
$85,514
Coverage Through
December 31, 2014
Source of Funds
| Source | Amount | Share |
|---|---|---|
| Large Individual ($200+) | $726,651 | 47.9% |
| Small Individual (<$200) | $6,496 | 0.4% |
| PACs & Party | $643,887 | 42.4% |
| Self-Funding | $-399,486 | -26.3% |
| Other | $539,549 | 35.6% |
Top Individual Donors
| Rank | Donor | Location | Total |
|---|---|---|---|
| #1 | F******* F. | LOS ANGELES, CA | $10,200 |
| #2 | A******* E. | GLENDALE, CA | $10,000 |
| #3 | S***** H. | LOS ANGELES, CA | $7,700 |
| #4 | S***** C. | LOS ANGELES, CA | $7,700 |
| #5 | M********* C. | HAWAIIAN GARDENS, CA | $7,500 |
Top Spending Recipients (Vendors)
| Rank | Payee / Vendor | Total |
|---|---|---|
| #1 | Sg&A Campaigns | $151,293 |
| #2 | United States Treasury | $123,165 |
| #3 | Abrams, Scott | $112,735 |
| #4 | Fraioli & Associates | $68,778 |
| #5 | Kaufman Legal Group | $68,728 |
Top Employer Contributors (via Employees)
| Rank | Employer | Total |
|---|---|---|
| #1 | Self-Employed | $74,725 |
| #2 | Retired | $58,500 |
| #3 | Homemaker | $58,500 |
| #4 | Bordan Shoe Company | $10,200 |
| #5 | Rosen Partners | $10,100 |
Where Donations Came From
| Rank | State | Total | Donors | Share |
|---|---|---|---|---|
| #1 | CA | $545,613 | 482 | 75.1% |
| #2 | NY | $54,100 | 31 | 7.4% |
| #3 | VA | $18,910 | 17 | 2.6% |
| #4 | DC | $17,950 | 24 | 2.5% |
| #5 | MD | $15,000 | 15 | 2.1% |
| #6 | NJ | $14,000 | 21 | 1.9% |
| #7 | TX | $11,730 | 11 | 1.6% |
| #8 | IN | $8,200 | 4 | 1.1% |
| #9 | FL | $6,000 | 7 | 0.8% |
| #10 | GA | $5,250 | 4 | 0.7% |
| #11 | NV | $5,100 | 4 | 0.7% |
| #12 | LA | $4,500 | 3 | 0.6% |
| #13 | IL | $4,398 | 7 | 0.6% |
| #14 | AZ | $4,250 | 5 | 0.6% |
| #15 | WI | $2,400 | 1 | 0.3% |
| #16 | WA | $2,250 | 3 | 0.3% |
| #17 | NC | $1,500 | 2 | 0.2% |
| #18 | MN | $1,500 | 1 | 0.2% |
| #19 | KS | $1,250 | 1 | 0.2% |
| #20 | ND | $1,000 | 1 | 0.1% |
| #21 | OH | $1,000 | 1 | 0.1% |
| #22 | CT | $500 | 1 | 0.1% |
| #23 | WV | $250 | 1 | 0.0% |
All data sourced directly from FEC bulk files. Minor differences from other sites may occur due to filing amendments.