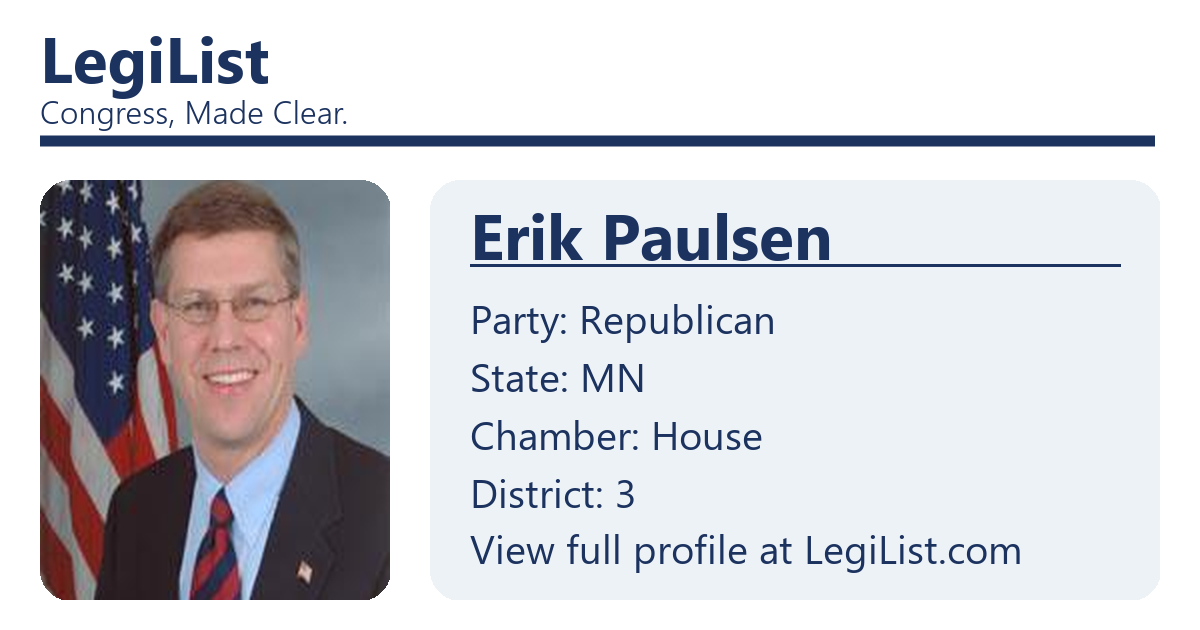
Erik Paulsen
Former Representative
FEC Campaign Finance
U.S. Representative
•
MN – District 3
Republican
•
Service: 2009-2019
Election Cycle
Overview – 2012
Total Raised
$3,113,793
Total Spent
$2,567,483
Cash on Hand
$693,846
Individual Contributions
$1,902,400
PAC + Party Money
$1,204,139
Self-Funding
$0
Coverage Through
December 31, 2012
Leadership & Fundraising Committees
| Committee | Type |
|---|---|
| GARRETT/PAULSEN JOINT COMMITTEE | Other (H/J) |
Source of Funds
| Source | Amount | Share |
|---|---|---|
| Large Individual ($200+) | $1,854,711 | 59.6% |
| Small Individual (<$200) | $47,689 | 1.5% |
| PACs & Party | $1,204,139 | 38.7% |
| Self-Funding | $0 | 0.0% |
| Other | $7,255 | 0.2% |
Top PAC Contributors
| Rank | PAC | Total |
|---|---|---|
| #1 | TARKANIAN FOR CONGRESS | $2,000 |
| #2 | PATON FOR CONGRESS | $2,000 |
| #3 | WEBER FOR CONGRESS | $2,000 |
| #4 | COLLINS FOR CONGRESS | $2,000 |
| #5 | PLUMMER FOR CONGRESS | $2,000 |
Top Individual Donors
| Rank | Donor | Location | Total |
|---|---|---|---|
| #1 | S********** J. | MINNEAPOLIS, MN | $11,300 |
| #2 | S******** W. | PORTOLA VALLEY, CA | $10,000 |
| #3 | T******* M. | SAINT PAUL, MN | $10,000 |
| #4 | C*** R. | EDINA, MN | $10,000 |
| #5 | F******* D. | PORTOLA VALLEY, CA | $10,000 |
Top Spending Recipients (Vendors)
| Rank | Payee / Vendor | Total |
|---|---|---|
| #1 | Strategic Media Services Inc. | $1,166,257 |
| #2 | Shanna Woodbury Consulting Llc | $316,166 |
| #3 | Townsend Group | $199,716 |
| #4 | Pinnacle Direct | $194,605 |
| #5 | Arena Communications | $53,466 |
Top Employer Contributors (via Employees)
| Rank | Employer | Total |
|---|---|---|
| #1 | Retired | $216,559 |
| #2 | Homemaker | $183,800 |
| #3 | Self | $109,025 |
| #4 | Self Employed | $32,350 |
| #5 | None | $24,450 |
Where Donations Came From
| Rank | State | Total | Donors | Share |
|---|---|---|---|---|
| #1 | MN | $1,450,836 | 1,531 | 78.2% |
| #2 | CA | $167,200 | 104 | 9.0% |
| #3 | FL | $59,850 | 52 | 3.2% |
| #4 | VA | $21,750 | 40 | 1.2% |
| #5 | WI | $18,625 | 15 | 1.0% |
| #6 | NJ | $16,050 | 11 | 0.9% |
| #7 | MA | $13,500 | 16 | 0.7% |
| #8 | AZ | $13,250 | 14 | 0.7% |
| #9 | NY | $13,150 | 18 | 0.7% |
| #10 | TX | $12,000 | 12 | 0.6% |
| #11 | DC | $11,250 | 19 | 0.6% |
| #12 | NC | $8,750 | 6 | 0.5% |
| #13 | PA | $7,550 | 16 | 0.4% |
| #14 | IL | $5,850 | 13 | 0.3% |
| #15 | MD | $5,500 | 10 | 0.3% |
| #16 | CT | $4,000 | 6 | 0.2% |
| #17 | OK | $3,750 | 2 | 0.2% |
| #18 | AL | $3,000 | 3 | 0.2% |
| #19 | KS | $3,000 | 5 | 0.2% |
| #20 | OH | $2,750 | 4 | 0.1% |
| #21 | NV | $2,250 | 3 | 0.1% |
| #22 | CO | $1,800 | 3 | 0.1% |
| #23 | MO | $1,550 | 5 | 0.1% |
| #24 | GA | $1,250 | 3 | 0.1% |
| #25 | WA | $1,000 | 3 | 0.1% |
| #26 | IA | $1,000 | 1 | 0.1% |
| #27 | MI | $1,000 | 1 | 0.1% |
| #28 | LA | $750 | 2 | 0.0% |
| #29 | NM | $500 | 1 | 0.0% |
| #30 | SD | $500 | 2 | 0.0% |
| #31 | ME | $500 | 1 | 0.0% |
| #32 | TN | $250 | 1 | 0.0% |
| #33 | KY | $250 | 1 | 0.0% |
| #34 | NE | $250 | 1 | 0.0% |
| #35 | ND | $250 | 1 | 0.0% |
All data sourced directly from FEC bulk files. Minor differences from other sites may occur due to filing amendments.