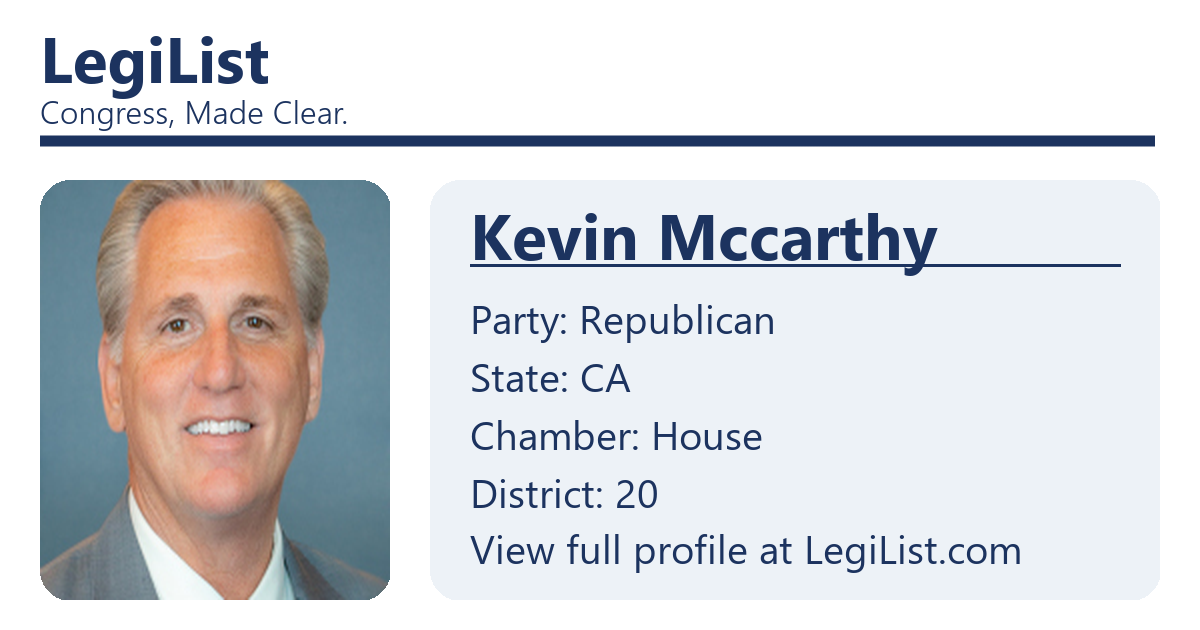
Kevin McCarthy
Former Representative
FEC Campaign Finance
U.S. Representative
•
CA – District 20
Republican
•
Service: 2007-2023
Election Cycle
Overview – 2018
Total Raised
$8,018,575
Total Spent
$8,249,322
Cash on Hand
$1,287,072
Individual Contributions
$609,124
PAC + Party Money
$3,204,909
Self-Funding
$0
Coverage Through
December 31, 2018
Leadership & Fundraising Committees
| Committee | Type |
|---|---|
| FOUR AMIGOS JOINT COMMITTEE; THE | Other Nonconnected PAC |
| MCCARTHY VICTORY FUND | Other Nonconnected PAC |
Source of Funds
| Source | Amount | Share |
|---|---|---|
| Large Individual ($200+) | $12,947,040 | 161.5% |
| Small Individual (<$200) | $-12,337,916 | -153.9% |
| PACs & Party | $3,204,909 | 40.0% |
| Self-Funding | $0 | 0.0% |
| Other | $4,204,542 | 52.4% |
Top PAC Contributors
| Rank | PAC | Total |
|---|---|---|
| #1 | WILLIAM TIMMONS FOR CONGRESS | $6,000 |
| #2 | DEBBIE LESKO FOR CONGRESS | $6,000 |
| #3 | CITIZENS TO ELECT PHIL ROE TO CONGRESS | $4,000 |
| #4 | FRIENDS OF ERIK PAULSEN | $4,000 |
| #5 | CRAWFORD FOR CONGRESS | $4,000 |
Top Individual Donors
| Rank | Donor | Location | Total |
|---|---|---|---|
| #1 | G***** L. | NORTHRIDGE, CA | $294,700 |
| #2 | W****** B. | SAN FRANCISCO, CA | $286,100 |
| #3 | F****** J. | SAN FRANCISCO, CA | $247,700 |
| #4 | K****** L. | IRVINE, CA | $244,200 |
| #5 | G**** B. | WASHINGTON, DC | $244,200 |
Top Spending Recipients (Vendors)
| Rank | Payee / Vendor | Total |
|---|---|---|
| #1 | Strategic Advance Services | $1,370,949 |
| #2 | Grand Valley Consulting | $1,336,605 |
| #3 | Cardmember Service | $910,548 |
| #4 | Payroll Network | $531,986 |
| #5 | Convergence Media | $444,750 |
Top Employer Contributors (via Employees)
| Rank | Employer | Total |
|---|---|---|
| #1 | Retired | $1,028,756 |
| #2 | Self-Employed | $752,877 |
| #3 | Homemaker | $489,300 |
| #4 | Western National Group | $294,200 |
| #5 | A. Wilsey Properties Co. | $286,100 |
Where Donations Came From
| Rank | State | Total | Donors | Share |
|---|---|---|---|---|
| #1 | CA | $6,636,599 | 834 | 51.3% |
| #2 | NY | $1,052,300 | 82 | 8.1% |
| #3 | VA | $916,381 | 223 | 7.1% |
| #4 | PA | $714,850 | 94 | 5.5% |
| #5 | TX | $702,549 | 145 | 5.4% |
| #6 | DC | $572,425 | 138 | 4.4% |
| #7 | FL | $479,450 | 89 | 3.7% |
| #8 | MA | $223,200 | 20 | 1.7% |
| #9 | IL | $205,250 | 31 | 1.6% |
| #10 | MD | $189,200 | 52 | 1.5% |
| #11 | IN | $143,200 | 38 | 1.1% |
| #12 | AZ | $142,300 | 11 | 1.1% |
| #13 | OH | $125,150 | 48 | 1.0% |
| #14 | CO | $116,200 | 27 | 0.9% |
| #15 | WV | $103,000 | 35 | 0.8% |
| #16 | NJ | $96,150 | 57 | 0.7% |
| #17 | AL | $68,066 | 17 | 0.5% |
| #18 | MO | $57,950 | 4 | 0.4% |
| #19 | NV | $54,200 | 10 | 0.4% |
| #20 | GA | $38,650 | 13 | 0.3% |
| #21 | WA | $29,950 | 12 | 0.2% |
| #22 | TN | $29,600 | 11 | 0.2% |
| #23 | KY | $27,400 | 14 | 0.2% |
| #24 | WY | $26,600 | 6 | 0.2% |
| #25 | NE | $25,000 | 1 | 0.2% |
| #26 | NC | $21,700 | 8 | 0.2% |
| #27 | CT | $21,600 | 13 | 0.2% |
| #28 | MI | $19,500 | 6 | 0.2% |
| #29 | SC | $18,000 | 5 | 0.1% |
| #30 | ZZ | $17,500 | 4 | 0.1% |
| #31 | OK | $14,700 | 4 | 0.1% |
| #32 | LA | $8,200 | 7 | 0.1% |
| #33 | UT | $7,900 | 6 | 0.1% |
| #34 | MS | $7,500 | 2 | 0.1% |
| #35 | KS | $7,495 | 11 | 0.1% |
| #36 | WI | $5,500 | 2 | 0.0% |
| #37 | MN | $5,400 | 2 | 0.0% |
| #38 | MT | $5,000 | 2 | 0.0% |
| #39 | NH | $3,000 | 2 | 0.0% |
| #40 | NM | $2,500 | 1 | 0.0% |
| #41 | DE | $2,000 | 1 | 0.0% |
| #42 | OR | $1,500 | 1 | 0.0% |
| #43 | SD | $1,000 | 1 | 0.0% |
| #44 | AK | $1,000 | 1 | 0.0% |
All data sourced directly from FEC bulk files. Minor differences from other sites may occur due to filing amendments.