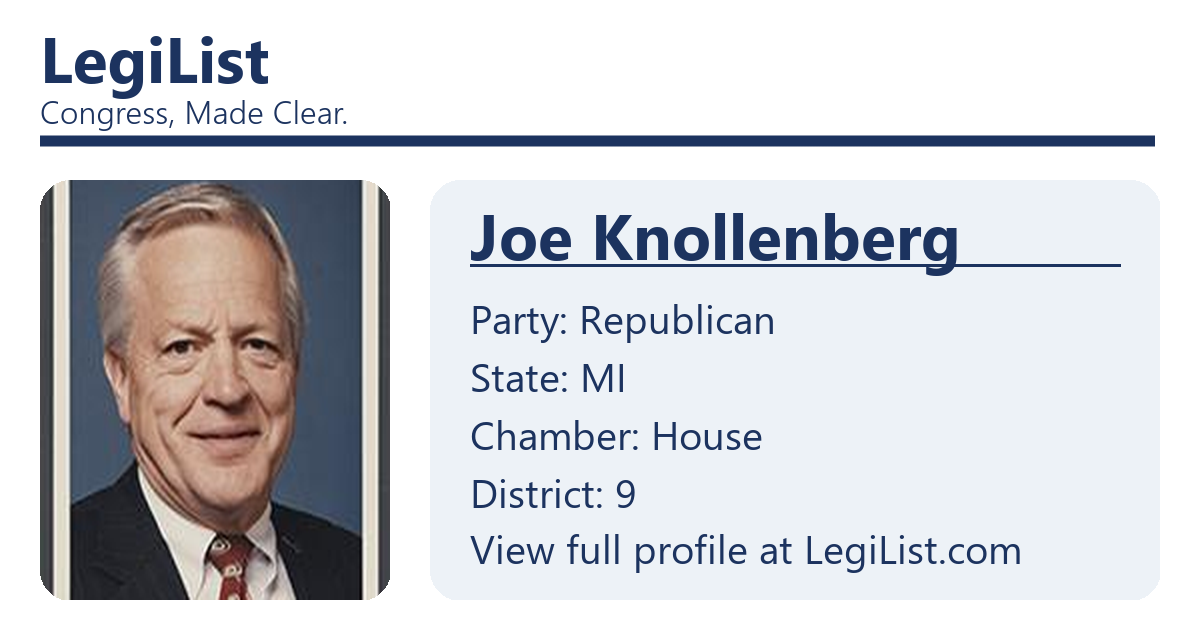
Joe Knollenberg
Former Representative
FEC Campaign Finance
U.S. Representative
•
MI – District 9
Republican
•
Service: 1993-2009
Election Cycle
Overview – 2004
Total Raised
$1,827,584
Total Spent
$1,412,326
Cash on Hand
$439,169
Individual Contributions
$1,363,449
PAC + Party Money
$454,362
Self-Funding
$0
Coverage Through
December 31, 2004
Source of Funds
| Source | Amount | Share |
|---|---|---|
| Large Individual ($200+) | $1,209,990 | 66.2% |
| Small Individual (<$200) | $153,459 | 8.4% |
| PACs & Party | $454,362 | 24.9% |
| Self-Funding | $0 | 0.0% |
| Other | $9,773 | 0.5% |
Top PAC Contributors
| Rank | PAC | Total |
|---|---|---|
| #1 | BUSH-CHENEY '04 INC | $2,000 |
| #2 | NETHERCUTT FOR SENATE | $2,000 |
| #3 | TAUZIN FOR CONGRESS | $2,000 |
| #4 | COMMITTEE TO ELECT MYRAH KIRKWOOD | $2,000 |
| #5 | JIM RYUN FOR CONGRESS | $1,000 |
Top Individual Donors
| Rank | Donor | Location | Total |
|---|---|---|---|
| #1 | S*********** R. | HUNTINGTON WOODS, MI | $5,000 |
| #2 | A***** E. | LAKE ANGELUS, MI | $4,000 |
| #3 | L*** R. | NOVI, MI | $4,000 |
| #4 | L**** J. | MARCO ISLAND, FL | $4,000 |
| #5 | I****** M. | DETROIT, MI | $4,000 |
Top Spending Recipients (Vendors)
| Rank | Payee / Vendor | Total |
|---|---|---|
| #1 | Adp Total Resources | $491,099 |
| #2 | Sandler, Bryce | $215,898 |
| #3 | Arena Communications | $146,150 |
| #4 | Renaissance Strategies | $108,183 |
| #5 | U.S. Bank National Association | $49,448 |
Top Employer Contributors (via Employees)
| Rank | Employer | Total |
|---|---|---|
| #1 | Self Employed | $110,800 |
| #2 | Homemaker | $90,125 |
| #3 | Retired | $49,700 |
| #4 | Penske Corporation | $16,750 |
| #5 | Ilitch Holdings Inc. | $12,000 |
Where Donations Came From
| Rank | State | Total | Donors | Share |
|---|---|---|---|---|
| #1 | MI | $957,040 | 1,215 | 79.4% |
| #2 | VA | $45,250 | 64 | 3.8% |
| #3 | DC | $38,500 | 45 | 3.2% |
| #4 | FL | $33,650 | 35 | 2.8% |
| #5 | NJ | $19,500 | 20 | 1.6% |
| #6 | TX | $14,550 | 14 | 1.2% |
| #7 | MD | $13,500 | 14 | 1.1% |
| #8 | CA | $12,300 | 18 | 1.0% |
| #9 | IL | $10,800 | 14 | 0.9% |
| #10 | NY | $10,250 | 10 | 0.9% |
| #11 | PA | $8,250 | 8 | 0.7% |
| #12 | MA | $7,700 | 11 | 0.6% |
| #13 | OH | $7,450 | 11 | 0.6% |
| #14 | WI | $5,000 | 6 | 0.4% |
| #15 | IN | $4,500 | 6 | 0.4% |
| #16 | RI | $2,600 | 5 | 0.2% |
| #17 | NC | $2,500 | 3 | 0.2% |
| #18 | TN | $2,500 | 3 | 0.2% |
| #19 | CT | $2,000 | 2 | 0.2% |
| #20 | DE | $2,000 | 1 | 0.2% |
| #21 | SC | $2,000 | 2 | 0.2% |
| #22 | LA | $2,000 | 2 | 0.2% |
| #23 | WA | $1,000 | 1 | 0.1% |
| #24 | NH | $500 | 1 | 0.0% |
| #25 | GA | $400 | 1 | 0.0% |
All data sourced directly from FEC bulk files. Minor differences from other sites may occur due to filing amendments.